VVARB guide: how to use the arbitrage screeners
01What this is
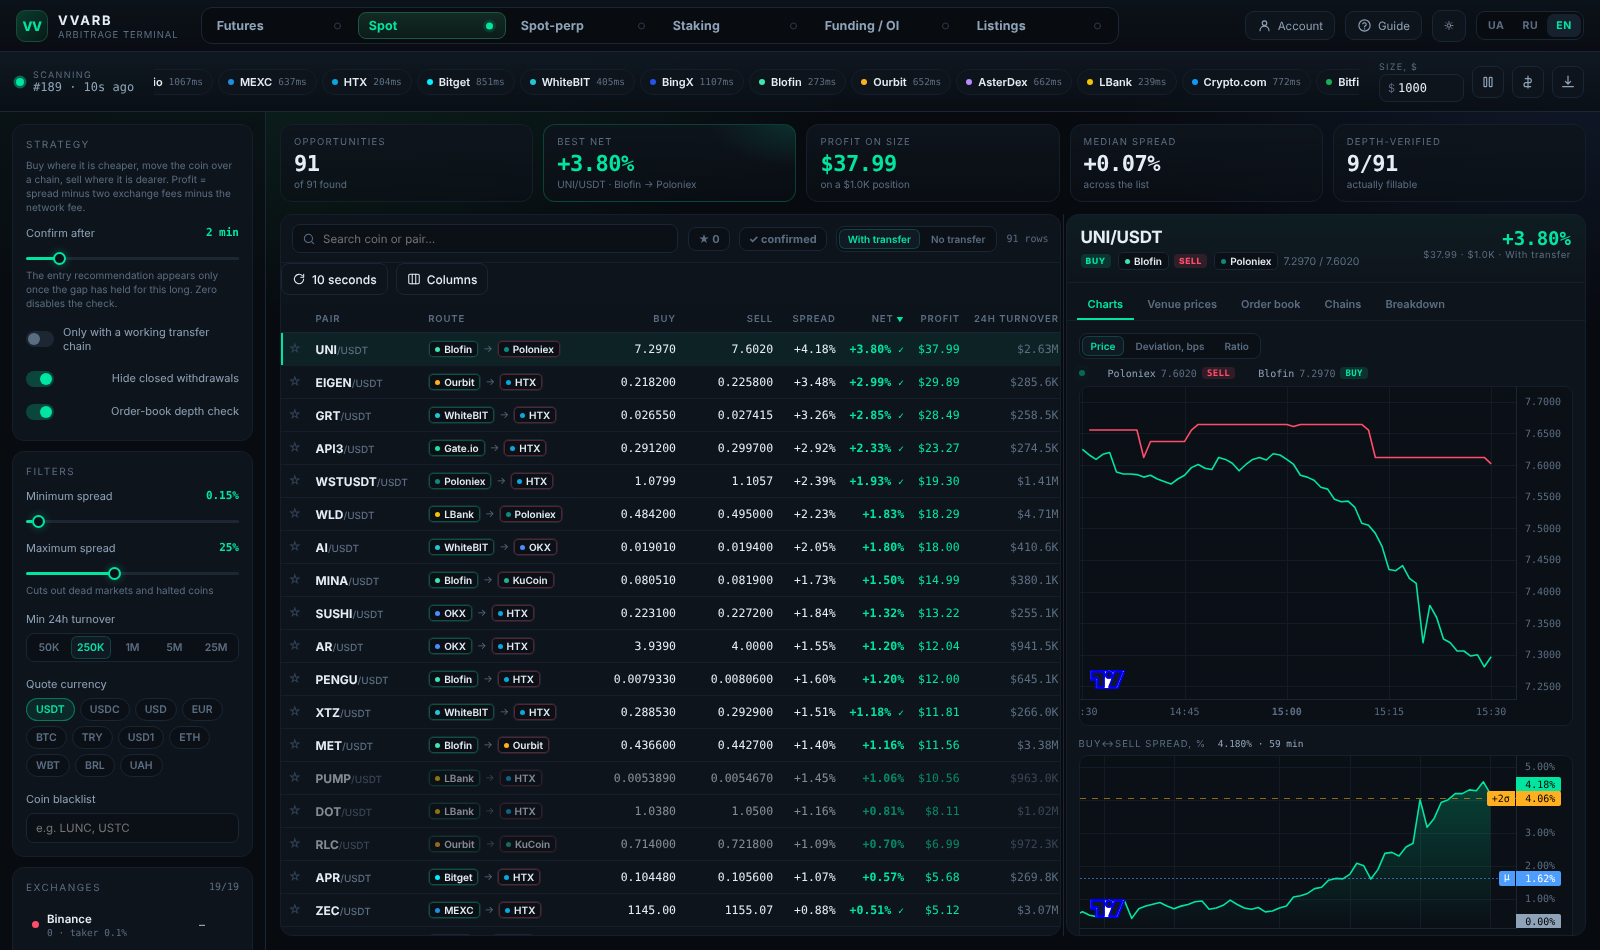
Six screeners in one window. Three of them are arbitrage screeners: all look for the same thing - the moment one coin is worth different amounts - but they make money from it in different ways. Spot moves the coin, futures put two legs on two exchanges, and Spot-perp catches the drift between a coin and its own contract. The other three, Staking with a hedge, Funding and OI, and Listings, are built on the same data and answer different questions.
| Mode | Where the money comes from | Main risk |
|---|---|---|
| Spot | Buy the coin where it is cheaper, move it over the blockchain to the exchange where it is dearer, and sell. The profit is the price difference itself. | While the coin is in transit, the price moves |
| Futures | A long on the cheap venue and a short on the dear one, at the same time. Nothing is transferred anywhere; the profit comes from prices converging and from the funding-rate difference. | Prices diverge further than your margin allows |
| Spot-perp | Buy the coin on spot and short its own contract at the same moment. The money comes from the price gap returning to what is normal for that pair, not to zero. | The gap drifts further from normal while you wait |
The difference matters. In spot mode you take on market direction for the duration of the transfer - if the coin drops 3% during ten minutes on-chain, a 1% spread will not save you. In the other two direction is irrelevant: whatever one leg loses, the other earns. What separates them is what comes back together - two exchanges’ prices on Futures, or a coin and its own contract on Spot-perp.
02Tabs, language and theme

Both scanners run all the time - twenty-four futures venues and twenty-two spot ones. The tab decides what you see, not what runs: the hidden scanner is needed continuously, because staking, funding and Spot-perp are built on its data. That last tab has no scanner of its own: it reads the quotes of both.
Switching does not reload the page - favourites, the selected coin and the collected chart history all stay put. A stopped mode keeps showing the last table it built, but marks plainly that it is no longer refreshing: the pulse in its header goes dark while the cycle age beside it keeps counting up.
The dot beside a tab reads like this. Green - a cycle just finished. Grey - no cycle in a while; red - the screener has been silent too long. The other three screeners have no cycle, so their dot is simply green.
Language - UA / RU / EN in the right corner. It switches instantly, without a reload, across every tab. The choice is remembered and applies to this guide too. Next to it is the theme: the sun turns the light one on, the moon brings the dark one back; dark is the default.
03What works the same in every tab
All six tabs share one frame: a header of key figures, a table, filters on the left and the breakdown of the selected row on the right. Learn one and you already know the rest.
Header and key figures

- Opportunities - how many rows pass your filters right now.
- Best net - the largest result after every fee, not the raw spread.
- Profit on size - the same thing in money, for your position size.
- Funding (futures) / Median spread (spot) - a read on the market as a whole.
- Depth-verified - how many of the listed rows actually fill at your size against the order book, not just at the top price.
That last one is the most useful figure on screen. A ratio like 9/106 means: a hundred and six opportunities are listed, but only nine survive your position size. The rest are a gap on the first level of the book that disappears the moment you send an order.
On the right of the header sit the position size and the buttons for sound alerts, pause, fee editing and CSV export.
The opportunity table
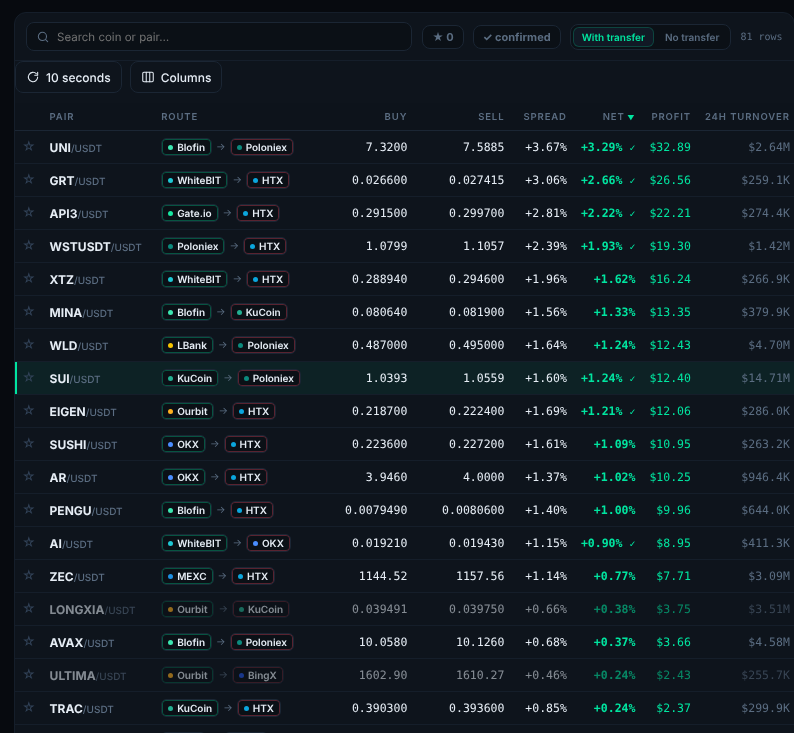
Columns sort on click. The column that matters is not spread but net: the first shows the price difference, the second what survives the fees. A row showing +0.30% spread and −0.10% net means the fees ate the opportunity whole.
Above the table sits the refresh button (for example, “5 seconds”): how often the table takes new prices. “Do not refresh” holds the table still while you study it. Next to it, “Columns” hides or brings back any column.
Above the table: search, a favourites-only filter (★) and a confirmed-only filter. Spot mode adds the “with transfer” / “no transfer” switch - see below.
The filter panel
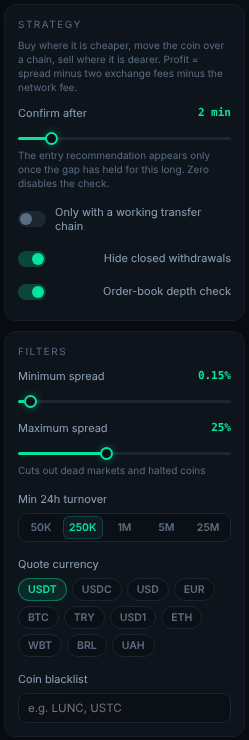
The settings that matter most:
| Setting | What it does and why |
|---|---|
| Minimum spread | Cuts the noise. Below ~0.05% a price difference means nothing. |
| Maximum spread | The most important filter. A 20% gap is almost always a halted withdrawal, a delisting or a stale price, not a gift. Do not raise it far. |
| Min. 24h volume | Cuts dead markets where the price is drawn by a single order. |
| Min. open interest | Futures only. A contract with no open interest has nobody to trade against. |
| Order-book depth check | Walks the real book for the top rows. It costs requests, but it is exactly what separates real opportunities from painted ones. |
| Alert from | The threshold for the sound alert. |
| Coin blacklist | Tickers you never want to see. |
At the bottom of the panel is the venue list. Any venue can be switched off and disappears from every calculation at once. A venue whose prices have drifted away from the rest of the market is benched automatically: every cycle BTC, ETH and SOL are checked against the median, and anything more than 2% off is treated as broken data.
Confirmation by duration
The most important idea in the spot and futures screeners. The recommendation to enter does not appear immediately. The divergence first has to hold for the number of minutes you set, and be present in at least 80% of scans over that window.
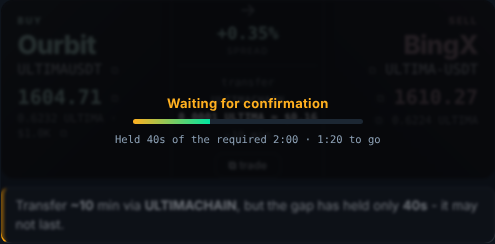
The reason is simple: a gap that appears for one tick is usually a late quote, not an opportunity. By the time you place two orders it is gone. A gap that holds for two minutes is a property of the market.
Confirmed 1:11 ago - how long since the condition was met. holding 3:41 - the total duration of the divergence. present in 100% of scans - it never flickered. minimum over that window - the worst value across the whole period; this is the number to look at, because it shows what you could actually have counted on, not the peak.
The status does not flicker at the threshold: it latches, and releases only on a clear deterioration. Neither does the venue pair flip - when two venues sit a tick apart, the screener does not swap them every cycle, which would reset the countdown for no reason.
The trade ticket
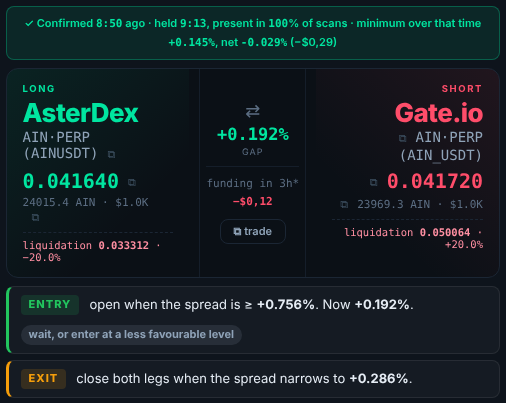
This is the screen you act from. On the left, where and what to buy (green); on the right, where and what to sell (red). The colours are the same everywhere in the program: green always means long or buy, red means short or sell.
The large numbers are the entry prices. Below them is the exact coin quantity for your position size. Every value has a copy button beside it - ticker, price and quantity copy in one click, so nothing has to be retyped into the exchange terminal. The “Trade” button opens both exchanges on the right pair.
In futures mode the liquidation price for your leverage is shown at the bottom of each leg, separately for the long and the short.
Charts
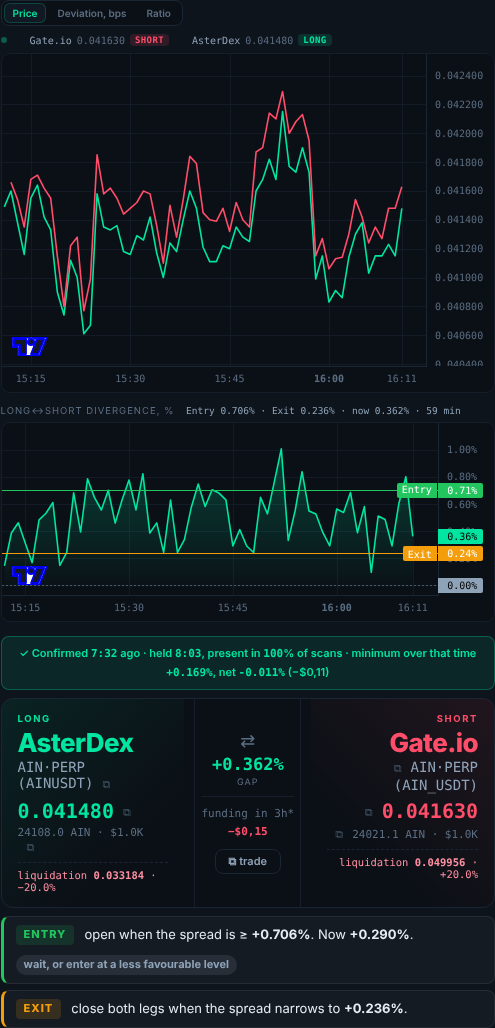
The upper chart carries exactly two lines - only the venues you are told to trade. Green is where you buy, red is where you sell. The other venues are deliberately left out: they turn the chart into a mess.
The lower chart is the divergence itself, in percent. The dashed lines are μ (the mean over the window) and the ±2σ bands. The caption reads: μ 882.249% · σ 2.274% · now 888.522% (+2.8σ) - the current value sits 2.8 standard deviations above what is normal for this pair. The larger the σ figure, the more unusual the situation, and the more reason to expect a return to the mean.
The Price / Deviation switch turns the upper chart into a normalised view in basis points - useful when two venues’ prices overlap visually. The 3m … 12h buttons change how far back it reaches. Live mode updates once per second; historical mode draws one-minute candles. The two resolutions never mix in one line.
Order book
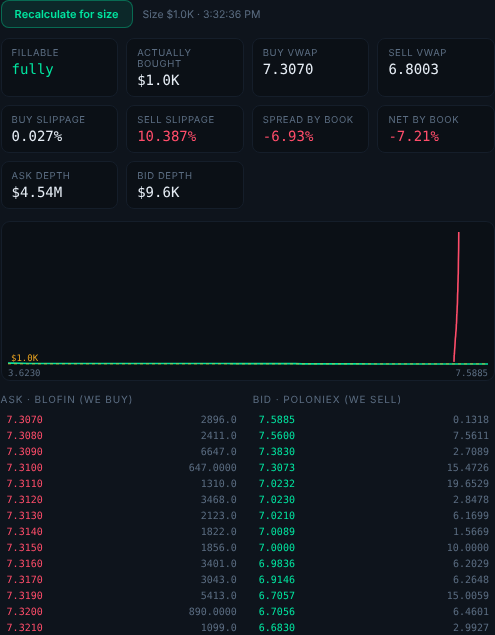
The order-book tab answers one question: what happens if you send an order for your size right now. The screener walks the book level by level and computes the average fill price of both legs.
A real case from this screener: a coin showed +1.147% at the top of the book. At $1,000 it was +0.938%. At $50,000 it came out at −1.056% - a guaranteed loss. The distance between the first and the third number is exactly what no spread table can show you.
04Spot mode
Buy cheaper → move the coin over the blockchain → sell dearer. Three costs stand between the spread on screen and money in hand: two trading fees, the network fee, and slippage in both books.
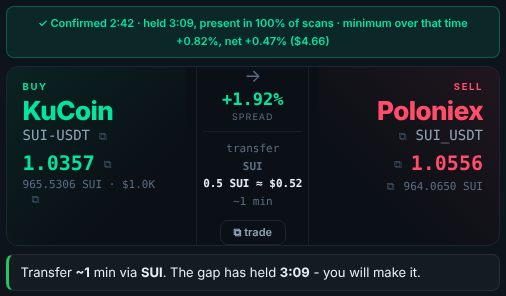
Two profit modes
The switch above the table changes what counts as profit:
| Mode | What it computes | When to use it |
|---|---|---|
| With transfer | The full cycle: buy → withdraw over the chain → sell. Spread minus two exchange fees minus the network fee. | Your money sits on one exchange |
| No transfer | Spread minus the two trading fees only. | You already hold balances on both venues - then you simply sell here and buy there |
The second mode offers far more opportunities and far less risk, because the longest and most dangerous link - time on-chain - disappears. The price of that is having capital spread across venues in advance.
Transfer chains
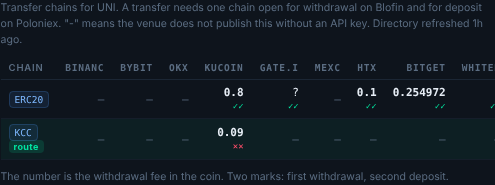
This is the most important tab in spot mode. A transfer is only possible where the same chain is open for withdrawal at the buying venue and for deposit at the selling one. The screener finds the cheapest such chain automatically and shows it in the “Chain” column.
Exchanges do not agree on chain names: ERC20, ETH and Ethereum are the same thing. The screener folds about sixty such variants onto shared keys - without that, matching “withdrawal open here” to “deposit open there” would be impossible.
Only KuCoin, Gate.io, HTX and Bitget publish their chain directories openly - about 7,100 coins. Binance, Bybit, OKX and MEXC will not give this without an API key. For those, the fee is estimated from the median of the others and marked with a tilde (~) or a question mark.
An estimate is never presented as fact, because an invented withdrawal fee quietly turns a loss into a profit on screen. Check the fee on the exchange itself before any real transfer.
Breakdown
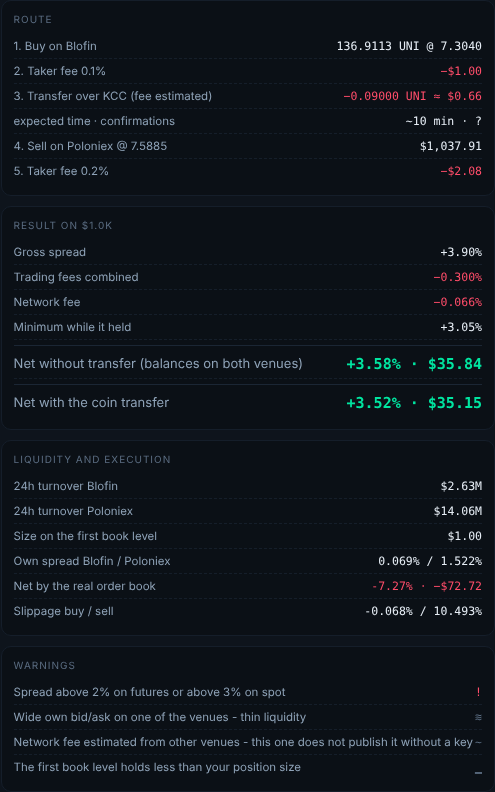
The breakdown tab shows the full path: how many coins are bought, what each fee takes, what survives the network, what it sells for. At the bottom is the warnings block, and that is what to read first:
- Abnormally large spread - above 3% on spot (above 2% on futures). Check deposits and withdrawals on both exchanges.
- A wide bid/ask spread on one of the venues - thin liquidity.
- The top of the book does not hold enough size for your position.
- The network fee is estimated from other exchanges’ data.
05Futures mode
A long on the cheap venue and a simultaneous short on the dear one. Unlike spot, nothing is moved between exchanges: the margin sits on both in advance, so there is no network fee and no time in the chain. The position is delta-neutral: market direction does not affect the result, because what one leg loses the other gains.
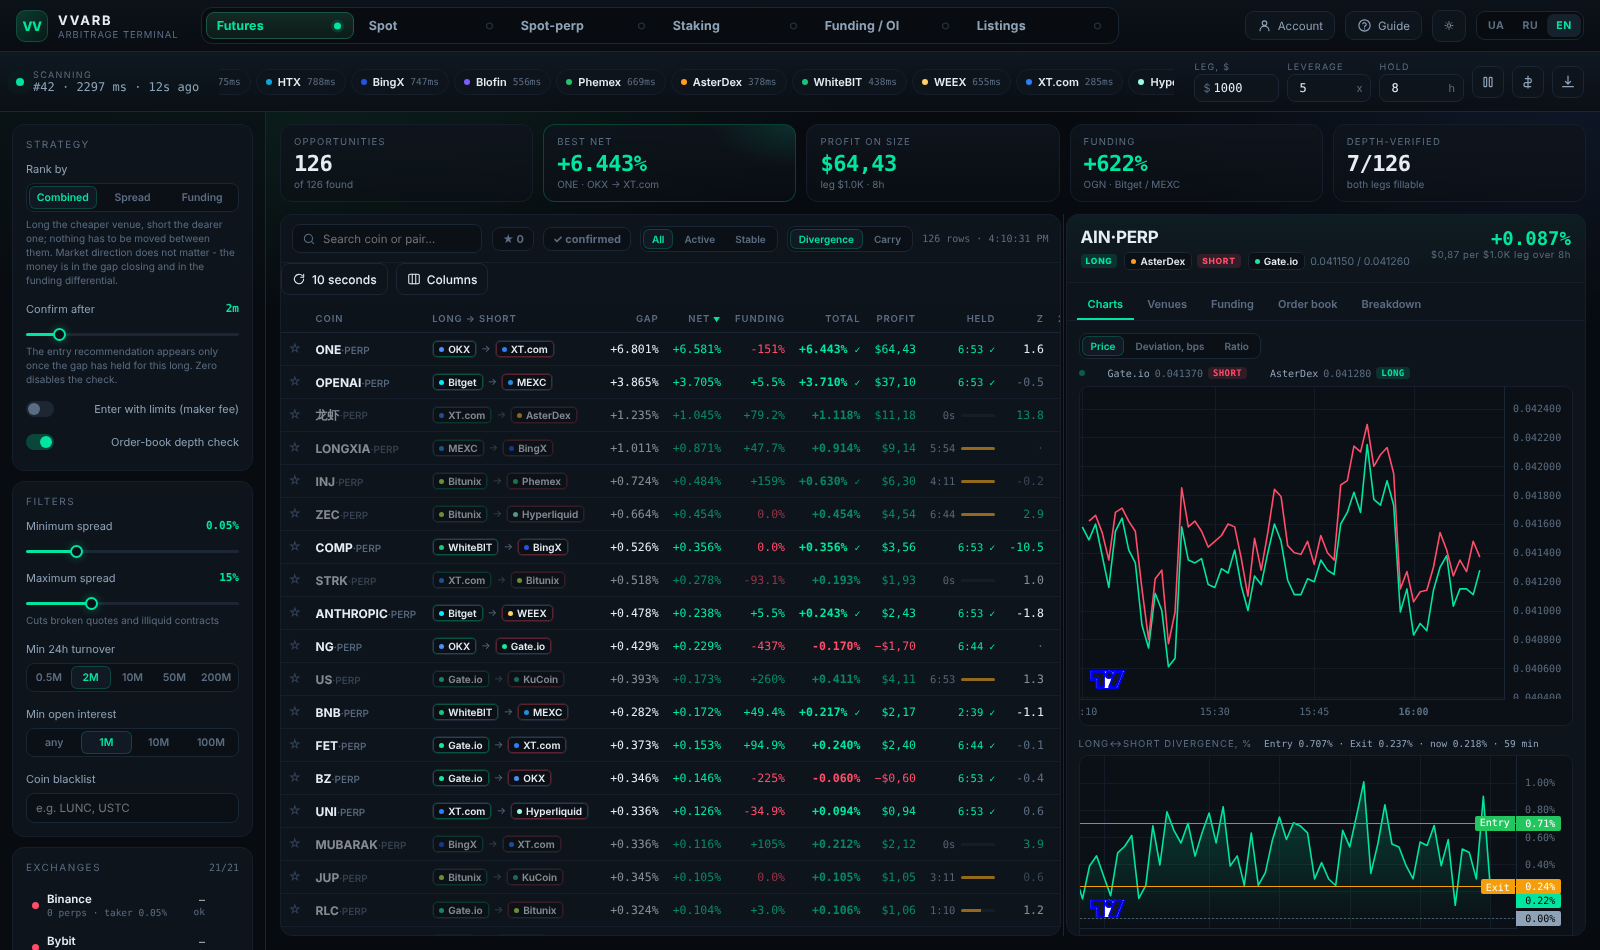
The profit here comes from two independent sources:
- Price convergence. You enter when prices have diverged and exit when they have come back together.
- Funding difference. Even if prices never converge, the rate difference can pay you every hour simply for holding the position.
The cost is four crossings of the book: opening both legs and closing both. That is why the “Net” column is always noticeably smaller than “Gap”.
The “Rank by” switch changes what is being hunted: Spread looks for price divergence, Funding for a pure carry trade, Total for both together.
Funding
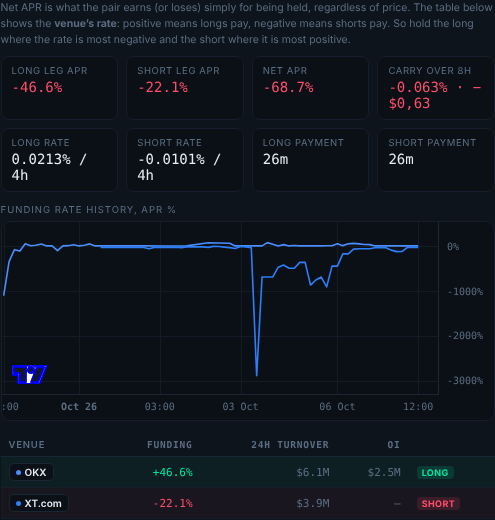
The funding rate is a payment between longs and shorts on perpetual futures. A positive rate means longs pay shorts; a negative one means the reverse. So it pays to hold the long where the rate is most negative and the short where it is most positive.
Exchanges settle funding on different schedules - hourly, four-hourly or eight-hourly. Raw rates cannot be compared across them, so the screener normalises everything to an annual rate (APR). APR is what the table and the header figure show.
The “Hold” field in the header sets how many hours of carry to count. If you plan to hold for 8 hours, a single funding interval may not accrue at all - in which case the whole calculation rests on price convergence alone.
Liquidation and leverage
The position is delta-neutral in aggregate, but each leg liquidates on its own. If prices diverge further instead of converging, one leg can reach liquidation before the other turns a profit - and the neutrality breaks at the worst possible moment.
The liquidation prices in the ticket are computed for the leverage set in the header. The higher the leverage, the closer both prices sit to the current one. For arbitrage, where the expected move is a fraction of a percent, high leverage does not raise the profit in proportion to the risk - it just brings liquidation closer.
Venues for a coin
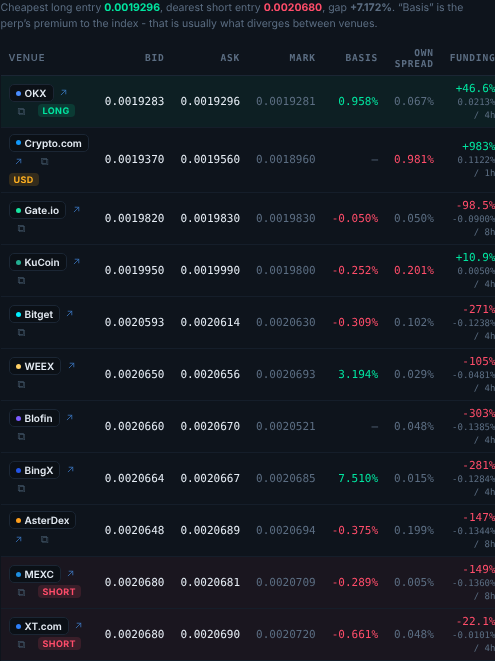
This tab tells you whether the divergence is real. If the price is an outlier on one venue while the rest agree, that is a problem with that venue. If the venues split into two groups, the divergence is genuine.
06Spot against the perpetual
The same coin on spot and in a perpetual contract. This tab does not look for the price gap. It looks for how far that gap has moved from the pair's own normal, and that is what makes it different from every other tab.
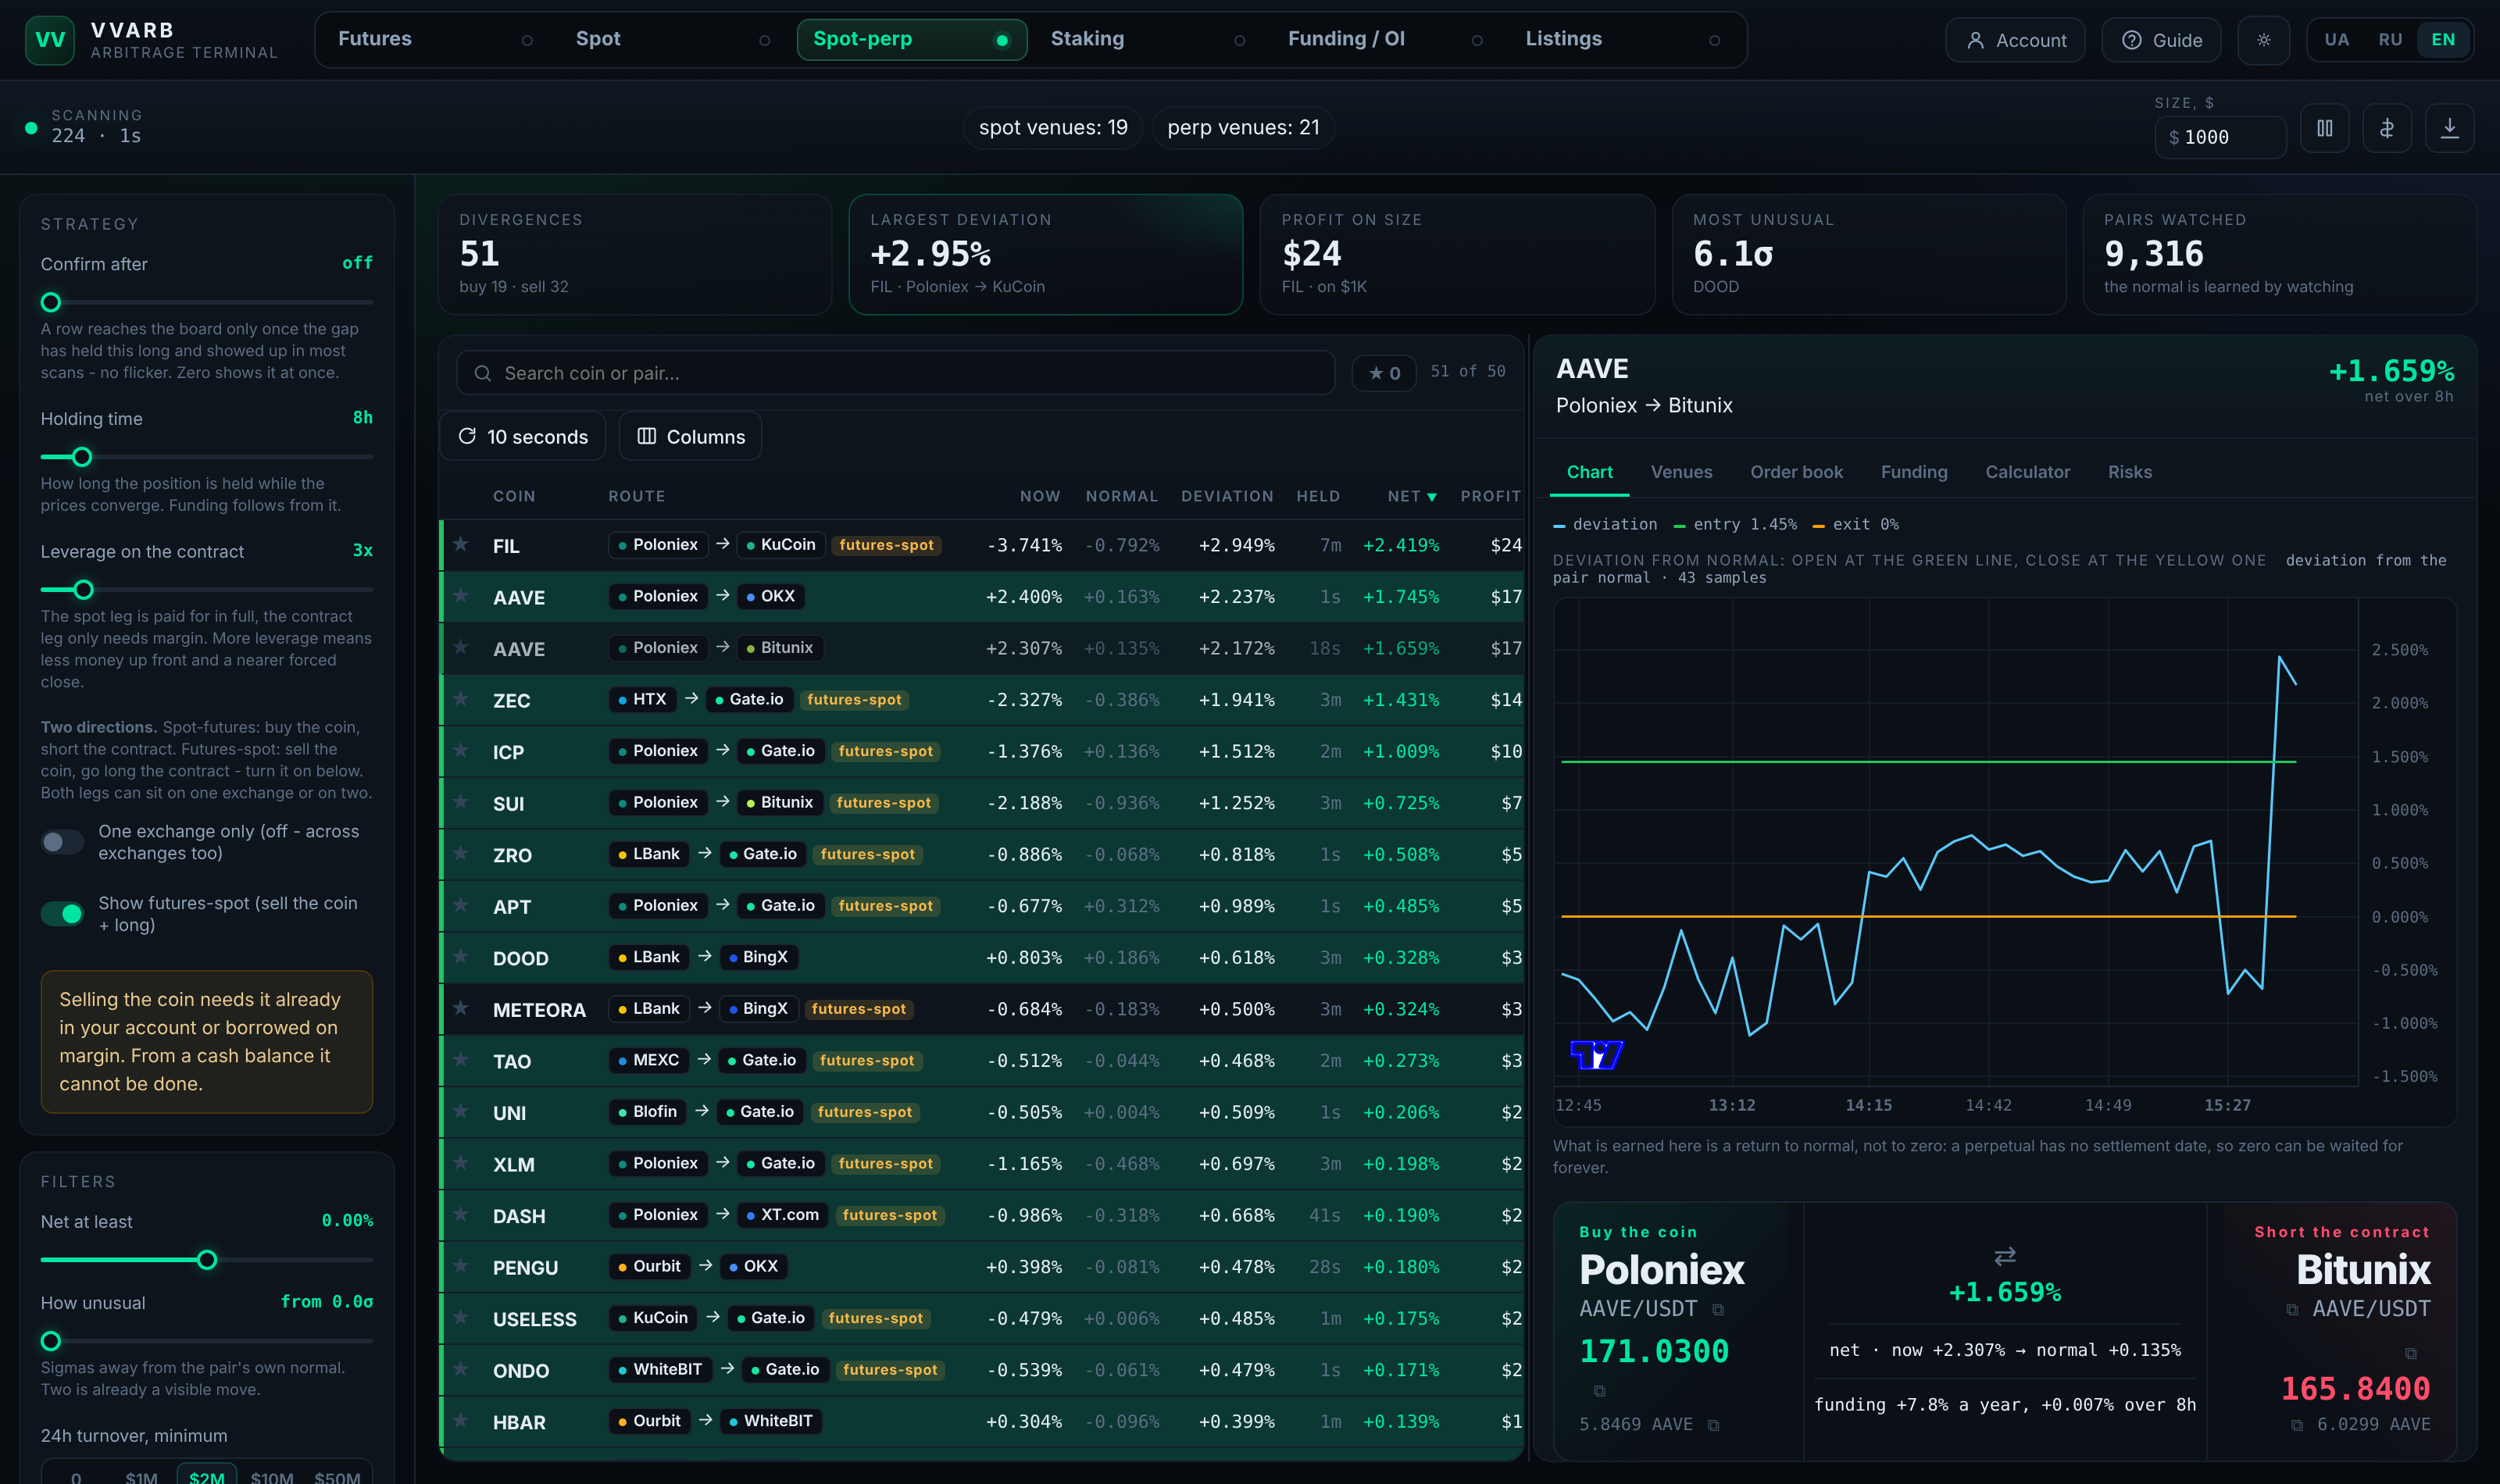
Every pair keeps a gap of its own for weeks. A contract that is always a quarter percent under its coin does not pay a quarter percent. It is simply that kind of pair. Of five thousand liquid pairs, half live with a gap that is nowhere near zero.
So three numbers sit side by side in the table: Now is the gap this minute, Normal is where the pair usually sits, and Deviation is the distance between them. The money is in the deviation, not in the gap.
The Sigmas column puts the deviation in units of that pair's usual movement. One pair wanders half a percent every day, another barely moves; the same deviation means different things for them. Two sigma is the conventional line beyond which a move stops being ordinary for the pair.
Where the normal comes from
It is measured by watching. Each pair's gap is recorded once a minute and averaged over the last four hours. Until there are twenty samples the pair does not appear in the table at all, and the board says plainly that it is still learning.
The normal is written to disk, so restarting the server does not reset it. On a brand new server, though, the first rows appear after about twenty minutes.
What you do by hand
- Buy the coin on spot at the ask, on the exchange named.
- Immediately short the contract on the second exchange named, for the same amount.
- Wait for the gap to return to normal - the number is printed under the ticket.
- Close both legs. Nothing is moved between exchanges at any step.
How much money it takes
The spot leg is paid for in full, the contract leg only needs margin. At $1,000 of size and 3x leverage, $1,333 is committed rather than $1,000. The On capital column restates the return against that money, and it is always smaller than the Net column.
The position is neutral in money but not in accounts. If the price rallies sharply the short is closed by the venue, and the gain on spot does not prevent it: that is a different exchange and a different asset. Under the ticket you are told how far the price may rise before that happens at the leverage you chose. Less leverage means a farther liquidation and more money needed.
The sell-spot direction
The reverse direction - sell the coin, buy the contract - is off by default, because from a cash balance it cannot be placed at all: the coin has to be held already or borrowed on margin. Switch it on and those rows appear, each marked 'coin needed'.
The funding rate counts as the cost of waiting: while the gap returns to normal, the short is paid or charged. The board never sorts on funding by default, because that puts pairs sitting exactly on their own normal with a wild rate at the top.
07Staking and hedge
A rate on a deposit is half the trade: if the coin falls, the interest will not save you. The other half is a short of the same coin on a perpetual. Price stops mattering and what is left is the APY plus the funding the short collects or pays.
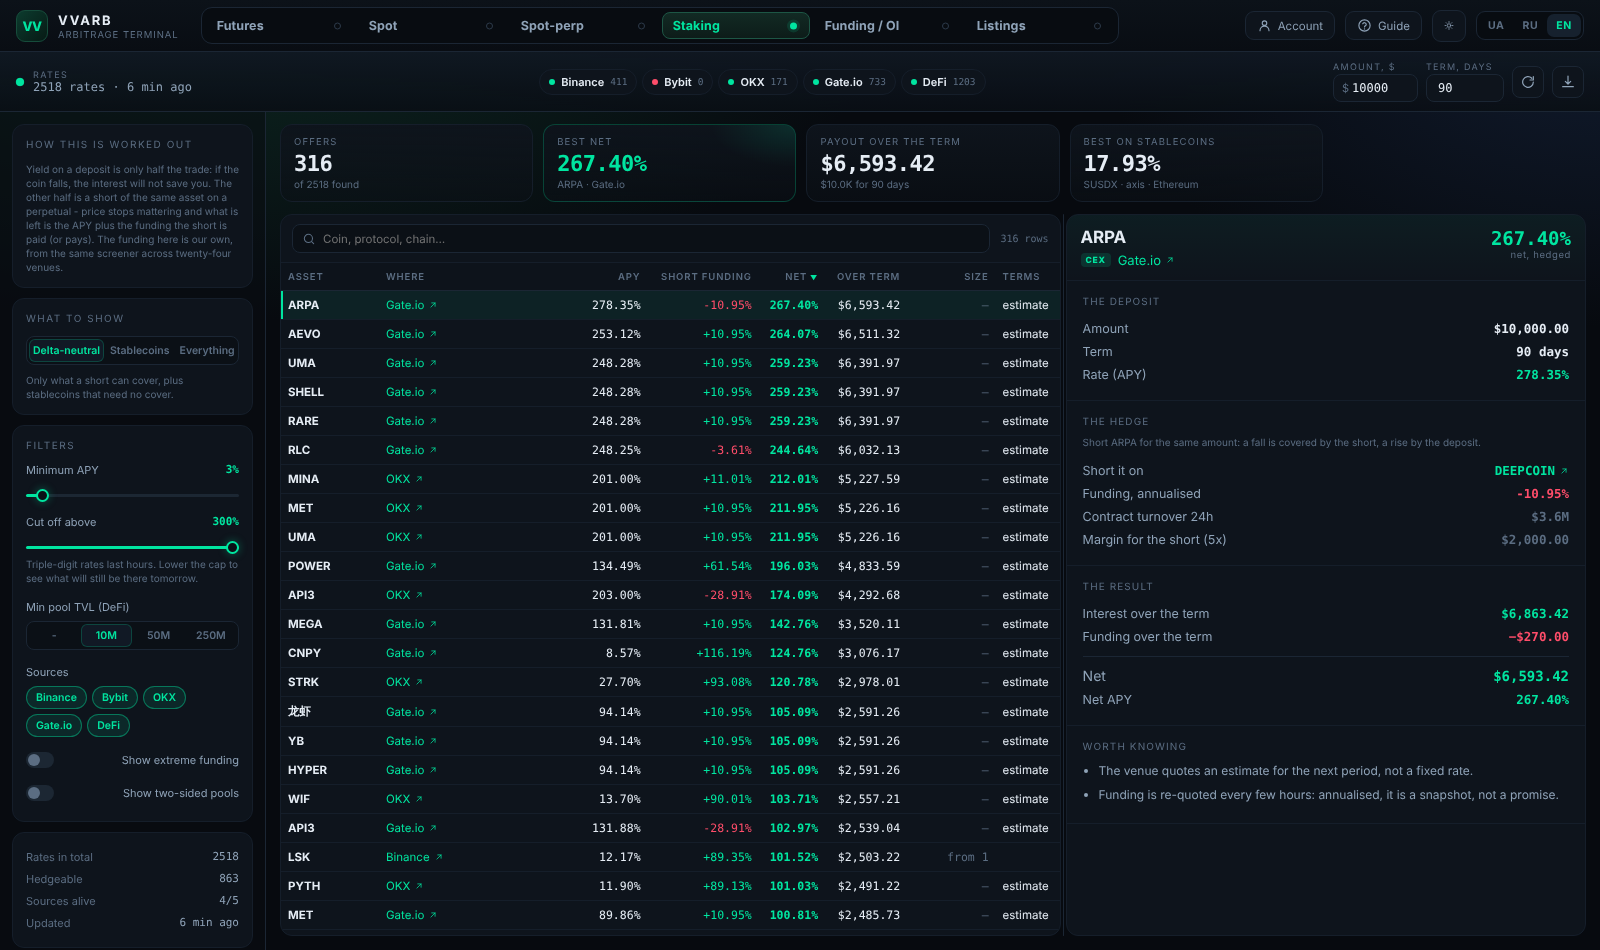
The rates come from Binance, Bybit, OKX, Gate.io and DefiLlama. Venues whose earn desks sit behind an account key are absent - showing a rate nobody can verify with a request is worse than showing nothing.
The calculator
Set an amount and a term at the top. The table answers in money: the interest, what funding adds or eats over that term, and the margin the short needs (at five times leverage, a fifth of the position).
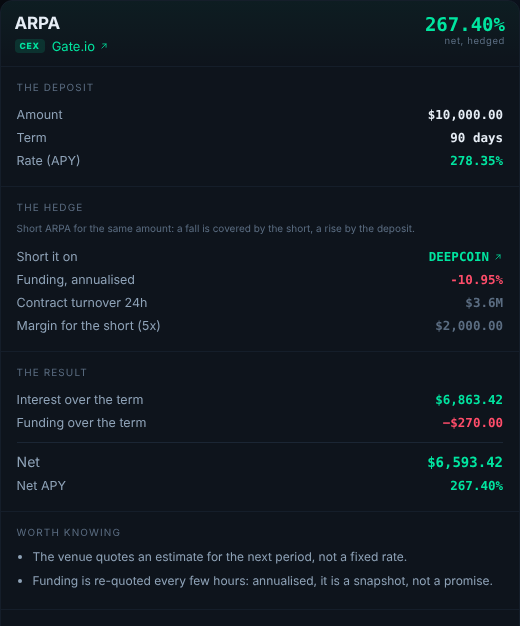
Funding is re-quoted every few hours. A rate of +200% a year only says that shorts are being paid generously right now - usually because the coin is overbought. The "cut off above" slider drops the triple-digit rates and leaves what has a chance of lasting.
- A hedge is only offered where the contract turns over at least $2m a day; below that the position cannot be filled.
- Tiered - the headline rate applies only to the first slice of the deposit.
- Estimate - the venue quotes what it expects to pay next period, not a fixed rate.
- Two assets - a two-sided pool, where a short does not cover the drift between them.
08Funding and open interest
Funding is the payment between longs and shorts every few hours. Positive means longs pay. A coin can pay 40% a year on one venue and nothing on the next - that difference is the trade, if you stand on both sides.
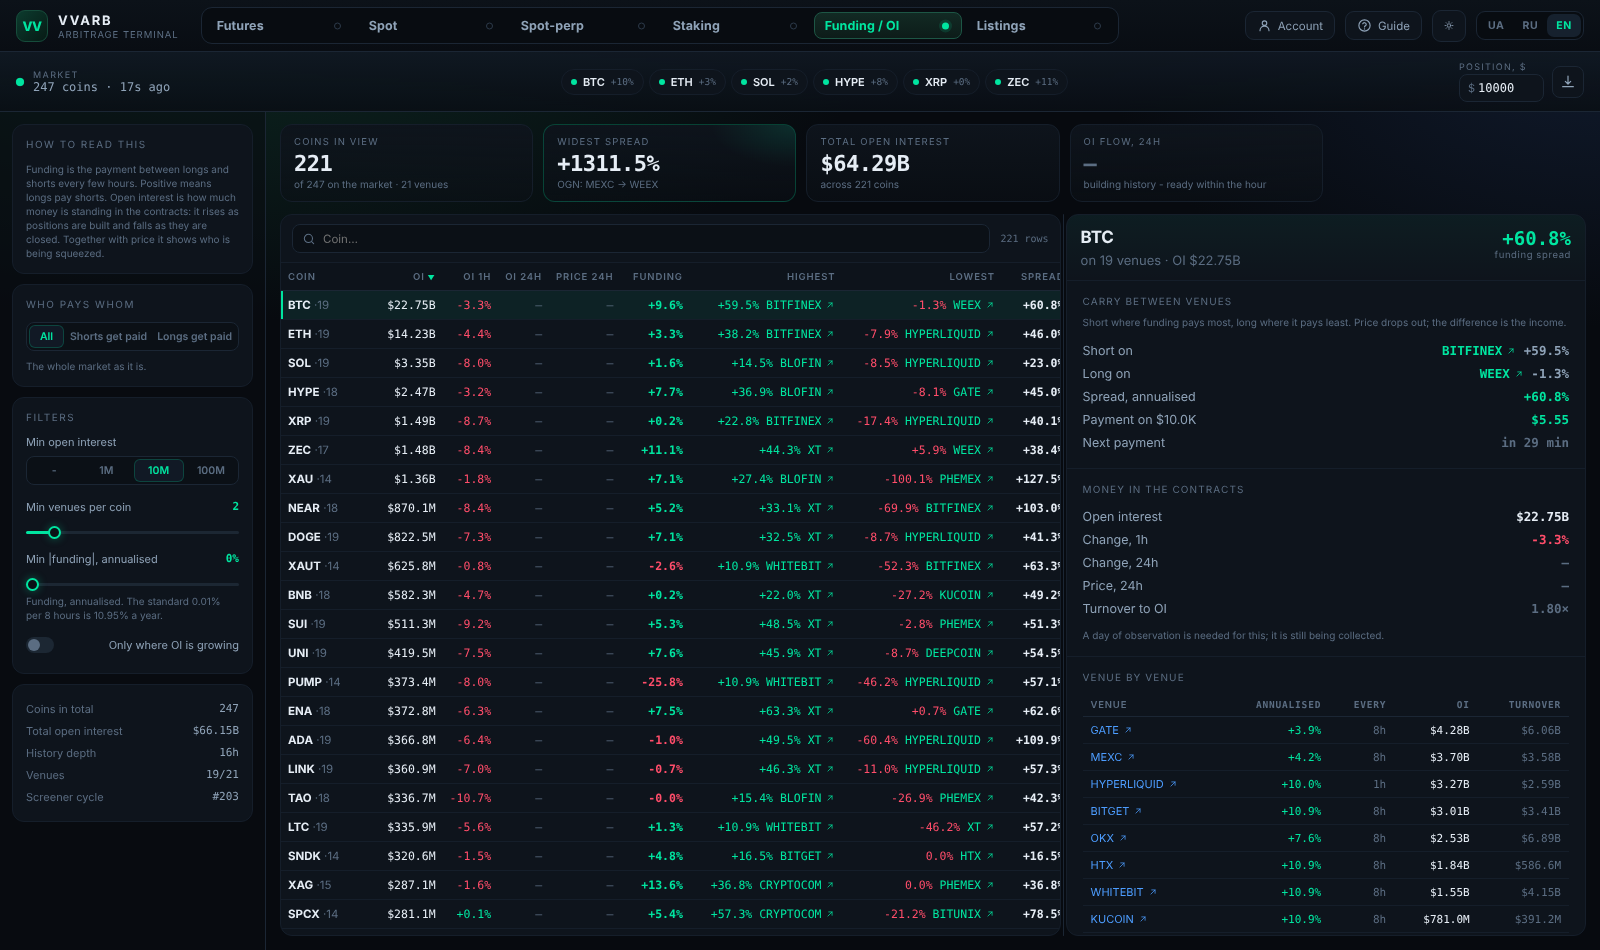
The average rate is weighted by open interest rather than by venue count: a rate on an empty contract is not what the market pays, it is what one venue quotes.
Carry between venues
Short where funding pays most, long where it pays least, for the same amount. The "per payment" column shows what that is worth on your position at one settlement. Legs are only taken from contracts turning over a million a day - otherwise the widest spread in the table always belongs to a dead contract pinned at its venue funding cap.
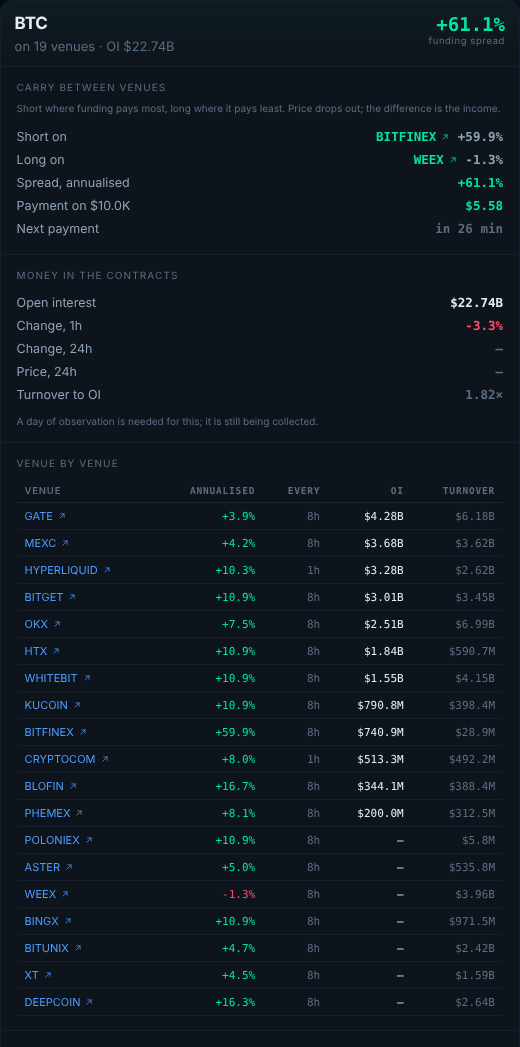
The screener is open to any confirmed account, but it shows a recording eight hours old - one full settlement period, so every rate on it has already been paid and re-quoted. The "next payment" column is empty in that mode: there is nothing left to count down to. A subscription makes it live.
What open interest tells you
It rises as positions are built and falls as they are closed. Read against price it shows who is being squeezed: building into a rise means longs are piling in; building into a fall means shorts are; closing into a rise looks like shorts covering. The history is written every five minutes, so the 1h and 24h columns take a while to appear after a restart.
09Listings and delistings
Announcements from Binance, Bybit and OKX in one feed. The news alone is not much use, so each event carries the thing that matters: how many venues already trade the coin, according to our screeners.
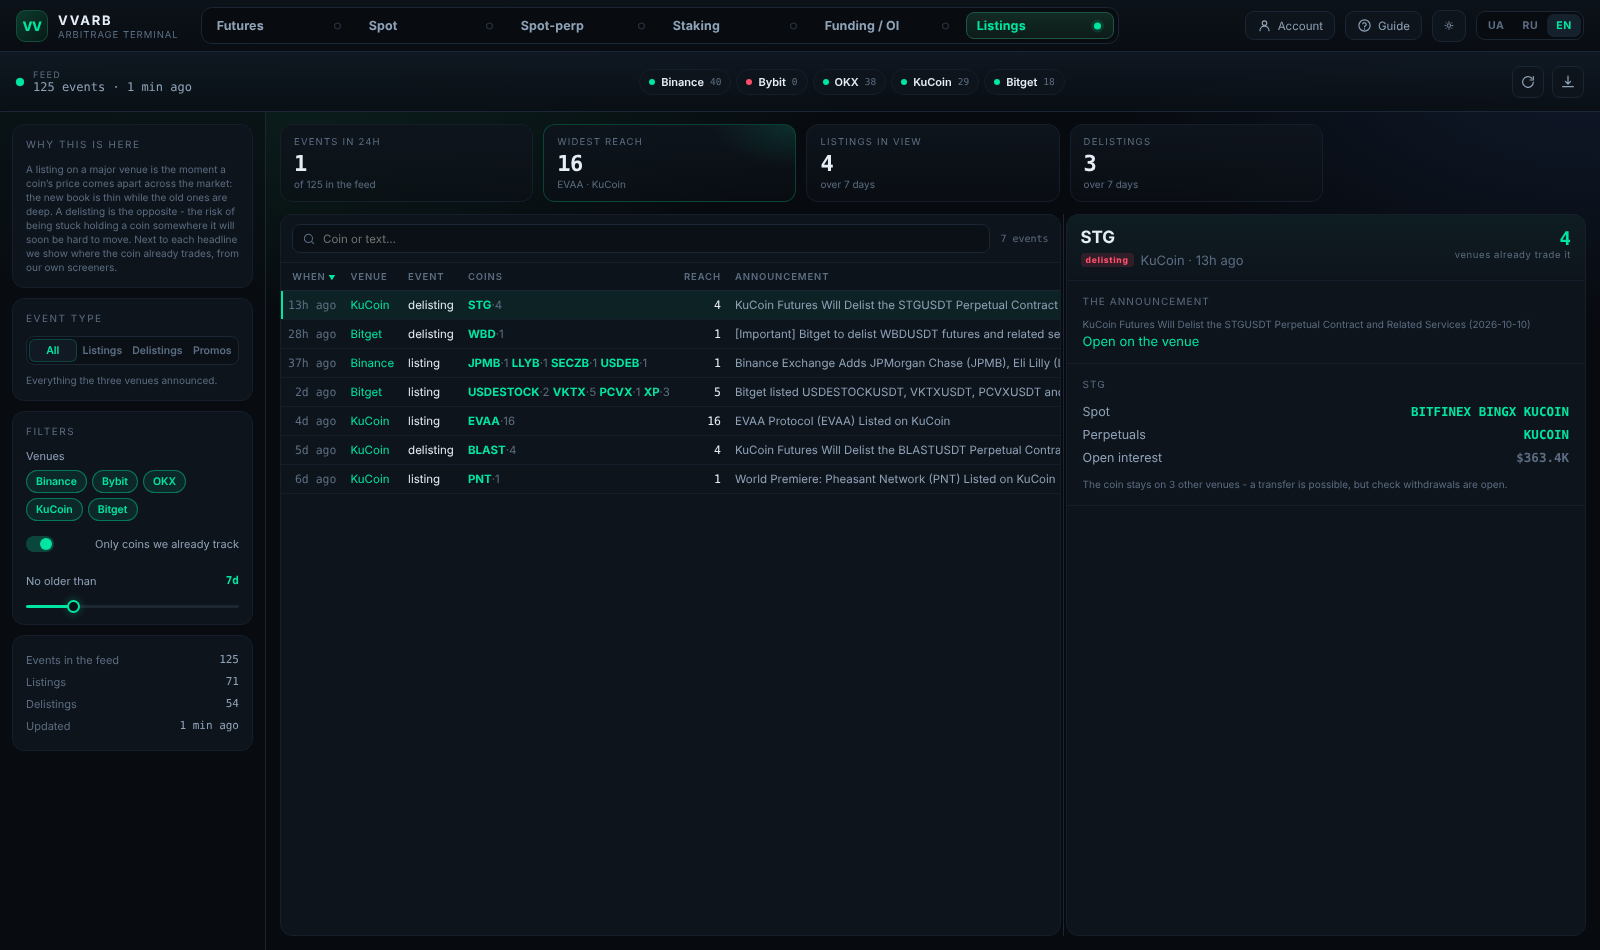
If a coin has traded on six venues for a year and a seventh adds it today, the new book is thin while the old ones are deep - and that is where the price comes apart in the first hours. If it trades nowhere else, there is nothing to trade against, however loud the announcement.
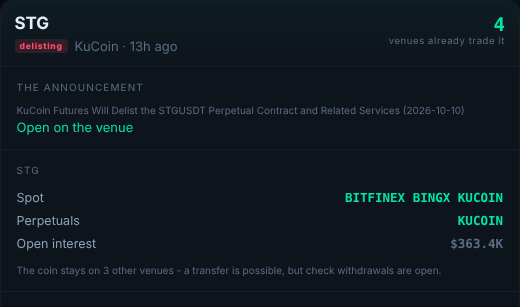
The danger is not the price but being left holding the coin somewhere it will soon be hard to move. The card shows which venues still trade it - that is, where it can go. Check that withdrawals are open on the network you plan to use.
Venues file their giveaways in the same category as listings. Those are labelled separately ("promo") and stay out of the counts.
10How to work with it
- Pick a tab. Money on one exchange - spot. Capital spread out and you need market neutrality - futures. Money that should sit and earn - staking.
- Set the position size in the header. Every percentage and amount is recomputed for it - the numbers at $1,000 and at $50,000 look nothing alike.
- Bring the maximum spread down to something sane. Anything above it is nearly always a halted withdrawal or a delisting.
- Turn on the order-book depth check and watch the “Depth-verified” figure.
- Wait for confirmation. A locked ticket means the condition is not met yet. Do not enter early.
- Read the breakdown tab, warnings block first.
- In spot mode, check the chain on the Chains tab, and verify the withdrawal fee on the exchange itself if it is marked as an estimate.
- Copy values with the buttons and open both venues with the “Trade” button.
- Before you commit, look at Funding / OI and Listings: the first says who is paying whom on this coin right now, the second whether a venue is about to drop it.
11What the software does not know
The screener works purely from public exchange data. It holds no API keys, cannot see your balances and places no orders. Every action is yours.
- It does not know whether you hold a balance on the venue, or whether your account is verified for withdrawals.
- It does not know your personal fees - the fee panel lets you set them by hand for your VIP tier.
- It does not know withdrawal limits, freezes or regional restrictions on your account.
- Withdrawal fees on fifteen of the twenty-two spot venues are an estimate, not a fact: only seven publish them openly.
- On-chain transfer time is typical, not guaranteed. On a congested chain five minutes easily becomes an hour.
- The divergence shown existed as of the last cycle. Time passes between that cycle and your order.
The number on screen is the upper bound of what is achievable, not the expected result. Every step between the screen and a filled trade - latency, slippage, fees, time on-chain - subtracts from it. The screener is built to show that gap honestly rather than hide it.